
El Meta Platforms, Inc. – Class A Common Stock se aproxima a el soporte de un Canal alcista
El Meta Platforms, Inc. – Class A Common Stock se está acercando a la línea de soporte de un Canal alcista. Ha llegado a esta línea en numerosas ocasiones durante los últimos 21 días. Si vuelve a probarla de nuevo, debería hacerlo en las próximas 2 días.
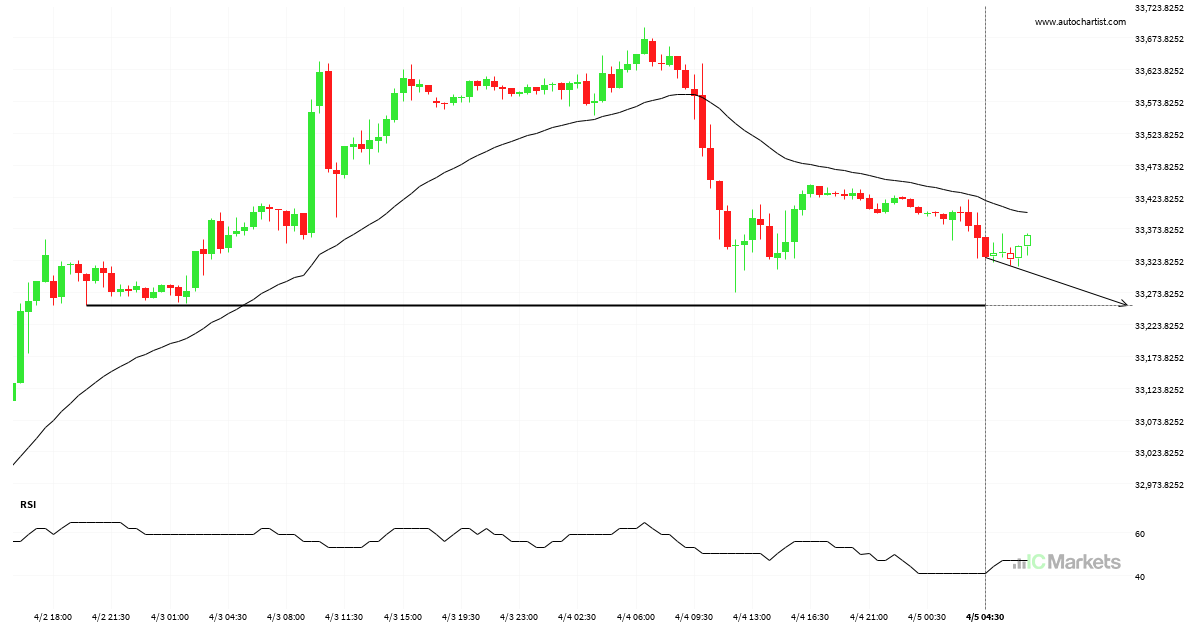
Un posible impulso final en el US Wall Street 30 Index
El US Wall Street 30 Index avanza hacia 33253.1016 y podría alcanzar este punto en un plazo de 11 horas. Ha probado esta línea previamente en numerosas ocasiones y esta vez no tiene porqué ser diferente, terminando con una recuperación en lugar de en una rotura. Si la rotura no ocurre, podríamos observar un retroceso […]
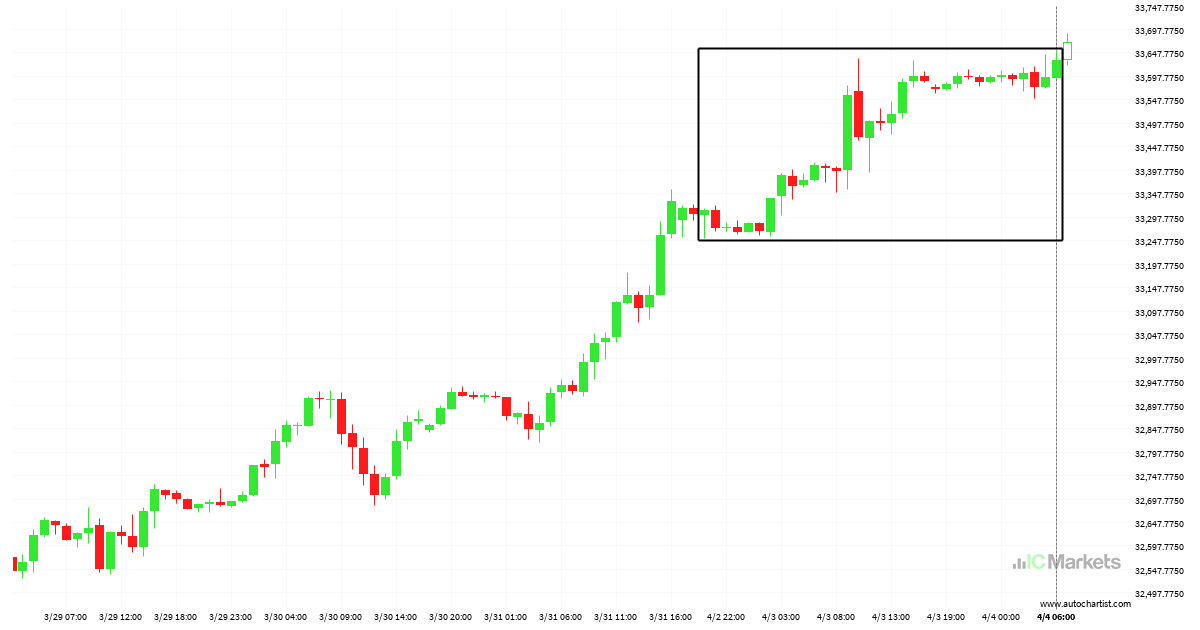
El US Wall Street 30 Index experimentó un movimiento excepcional
Para aquellos de ustedes que no creen en las tendencias, esta puede ser una oportunidad para aprovechar un excepcional movimiento de un 0,96% en US Wall Street 30 Index. Este movimiento ha ocurrido durante los últimos 2 días. Por otro lado, para aquellos que siguen las tendencias, deben considerar aprovecharse de esta.
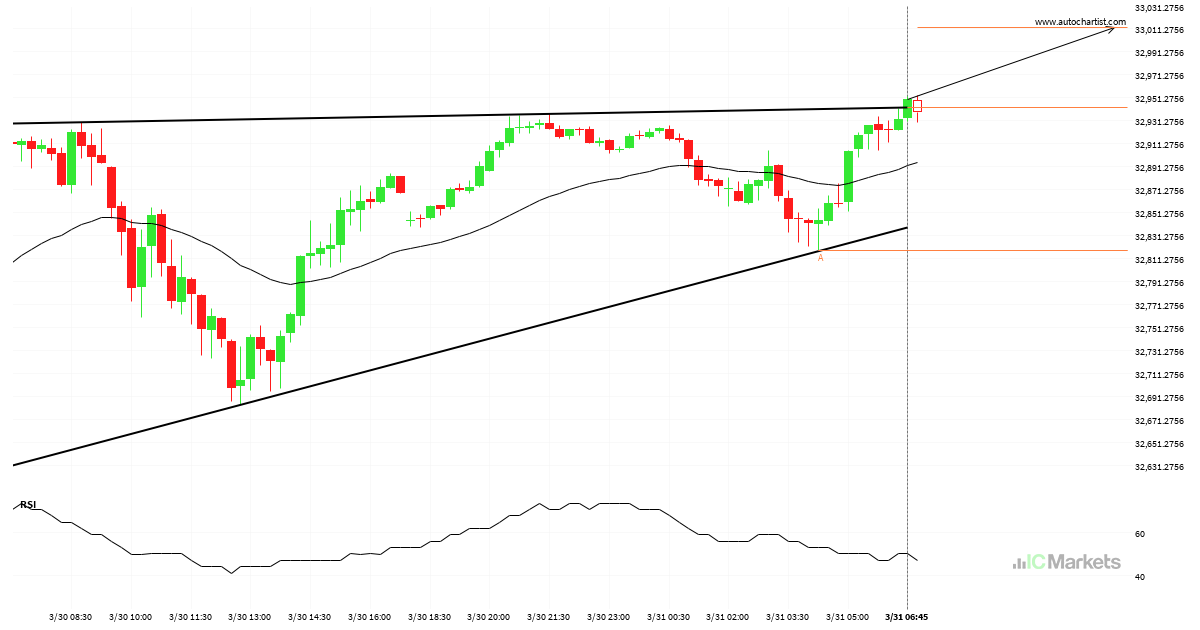
Se espera la posibilidad de un gran movimiento en el US Wall Street 30 Index
El US Wall Street 30 Index ha atravesado una línea de resistencia de un Triángulo ascendente y sugiere un movimiento posible a 33012.2511 dentro de las próximas 6 horas. Ya ha probado esta línea en el pasado, por lo que deberíamos esperar la confirmación de esta irrupción antes de entrar en acción. Si dicha ruptura […]
¿Qué está ocurriendo con el US Small Cap 2000 Index?
Aquellos de ustedes que sean seguidores de tendencias probablemente estarán observando ansiosamente US Small Cap 2000 Index para comprobar si el último movimiento de un 1,03% continúa. Si no lo hace, las personas fieles al método de reversión a la media estarán encantadas con este excepcionalmente gran movimiento de 11 horas.
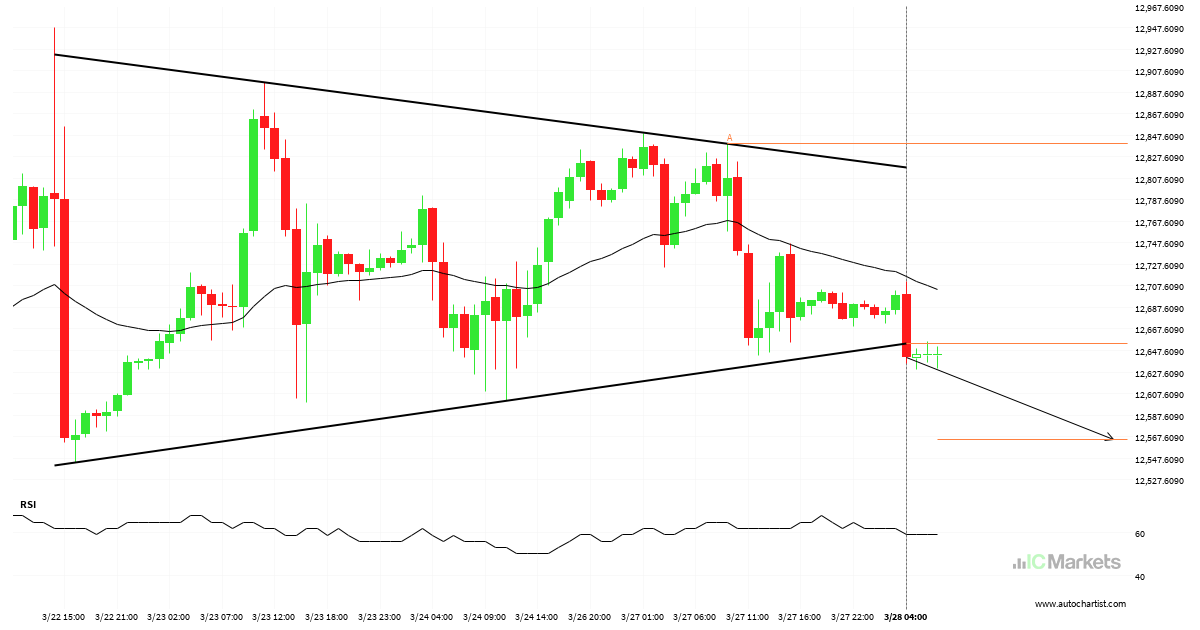
US Tech 100 Index – ha irrumpido la línea de soporte
El US Tech 100 Index ha atravesado la línea de soporte de un patrón de gráfico técnico con un Triángulo. Como le hemos visto retroceder desde esta posición en el pasado, deberíamos esperar la confirmación de la ruptura antes de actuar. Ha llegado a esta línea dos veces en los últimos 6 días y sugiere […]
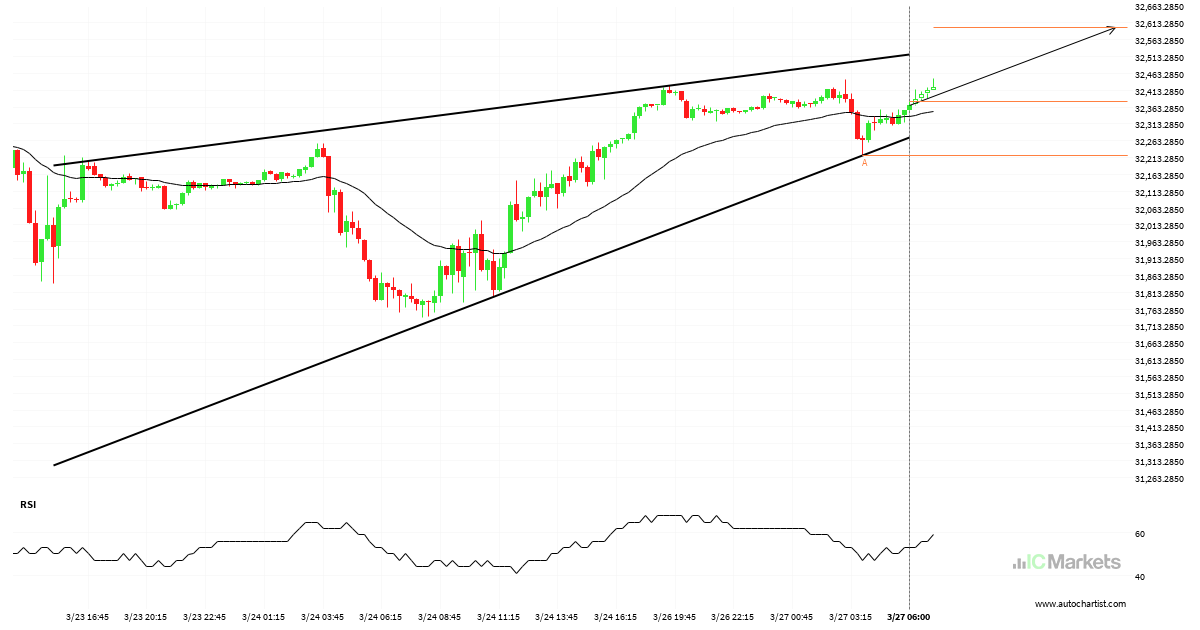
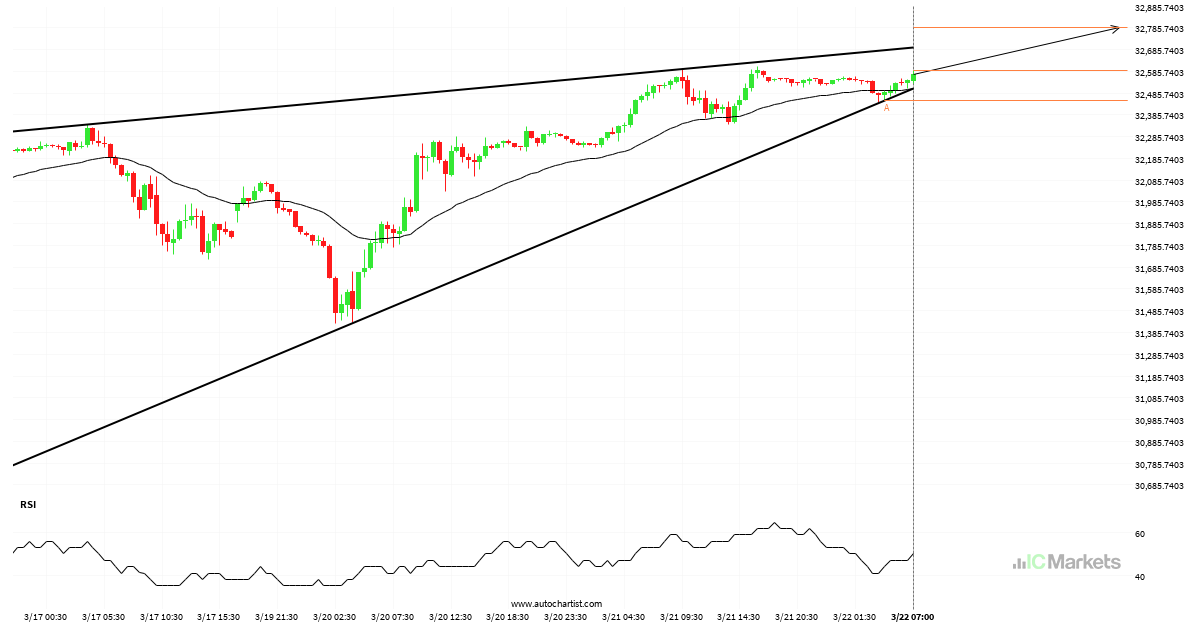
¿Tendrá el US Wall Street 30 Index suficiente impulso como para irrumpir la resistencia?
El US Wall Street 30 Index se dirige hacia la línea de resistencia de un Cuña ascendente y puede alcanzar este punto en las próximas 10 horas. Ha probado esta línea ya en numerosas ocasiones en el pasado, y esta vez no tendría porqué ser diferente y terminar con una recuperación en lugar de una […]
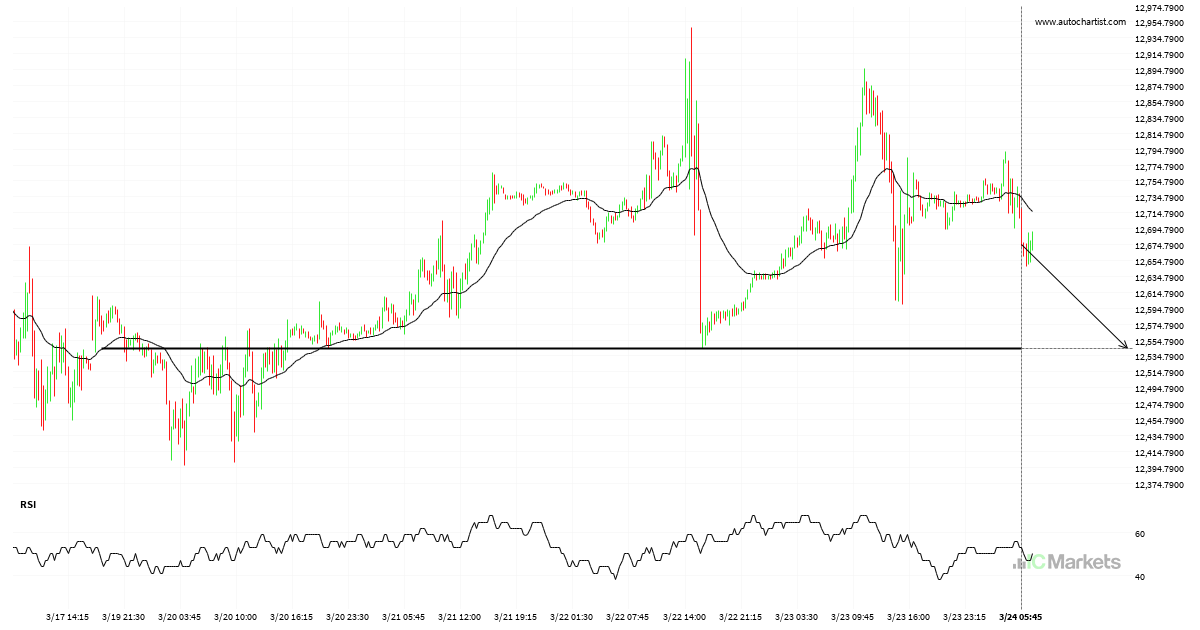
US Tech 100 Index – se acerca a la línea de precio psicológico
El US Tech 100 Index avanza hacia la línea de soporte de un Soporte. Como lo hemos observado retrocediendo desde este nivel en el pasado, podríamos observar, o bien una ruptura a través de esta línea o una recuperación de nuevo a los niveles actuales. Ya ha llegado a dicha línea en numerosas ocasiones durante […]
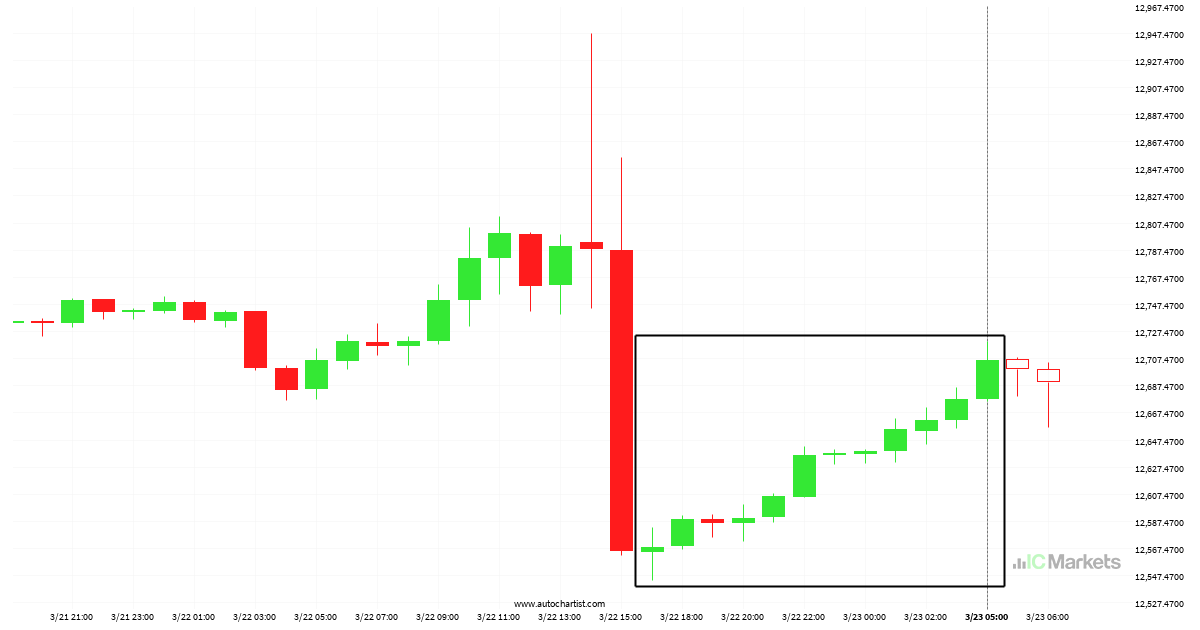
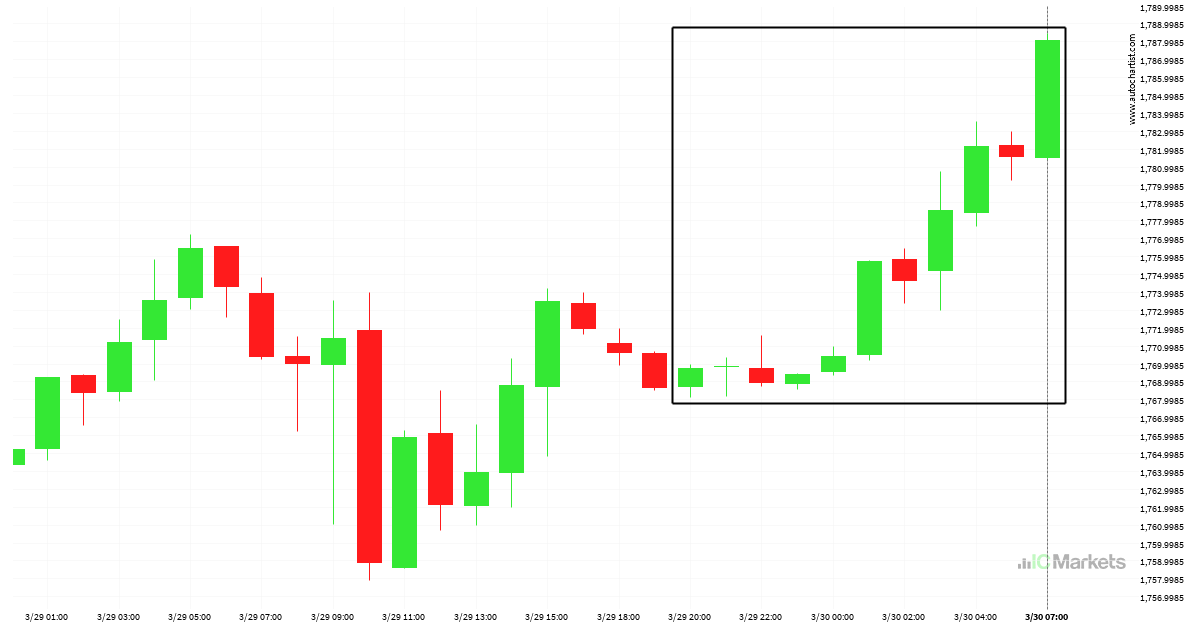
El US Tech 100 Index está en dirección up
El US Tech 100 Index ha experimentado un excepcional movimiento ascendente de un 1,09% de 12568.8 a 12706.4 en 13 horas.
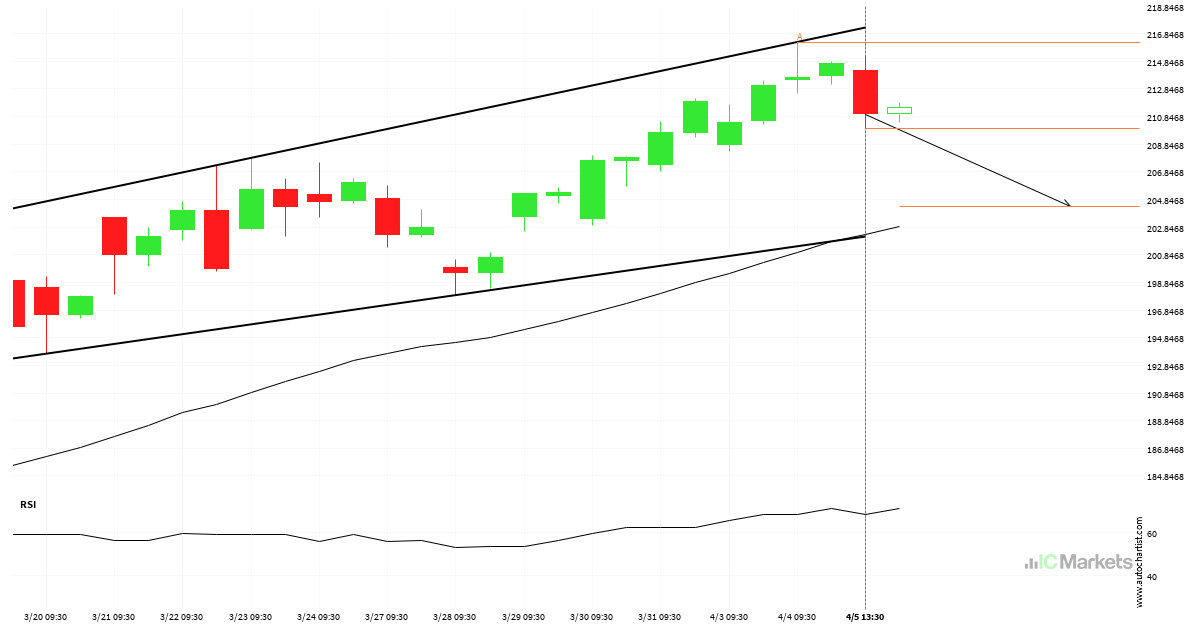
¿Tendrá el US Wall Street 30 Index suficiente impulso como para irrumpir la resistencia?
El US Wall Street 30 Index se dirige hacia la línea de resistencia de un Cuña ascendente y puede alcanzar este punto en las próximas 23 horas. Ha probado esta línea ya en numerosas ocasiones en el pasado, y esta vez no tendría porqué ser diferente y terminar con una recuperación en lugar de una […]